
In Warren Buffett’s 2013 letter to Berkshire Hathaway shareholders, he described what he had written into his will for the trustee managing his wife’s inheritance: put 10% in short-term government bonds and 90% in a very low-cost S&P 500 index fund. “I believe the trust’s long-term results from this policy,” he wrote, “will be superior to those attained by most investors — whether pension funds, institutions, or individuals — who employ high-fee managers.”
The man who built one of the greatest investment records in history isn’t leaving his wife a portfolio of hand-selected stocks. He’s leaving her the S&P 500.
That tells you nearly everything you need to know about why this index matters. This article tells you everything else.
What is the S&P 500?
The S&P 500 — formally the Standard & Poor’s 500 — is a stock market index that tracks the performance of 500 of the largest publicly traded companies in the United States. It is maintained by S&P Dow Jones Indices, a division of S&P Global, and is widely considered the single best benchmark for the overall health and performance of the U.S. stock market.
The index was created in its current form in 1957, though its predecessor dates to 1926, when the Standard Statistics Company first began tracking a broad basket of U.S. stocks. Over nearly a century of history, it has become the primary reference point that investors, fund managers, economists, and central banks use to understand what American equity markets are doing.
When people say “the market is up” or “the market is down,” they are almost always referring to the S&P 500.
How does the S&P 500 work?
The S&P 500 is not simply a list of the 500 largest American companies. It has specific eligibility requirements and a structure that determines how much influence each company has on the overall index.
Eligibility requirements. To be included in the S&P 500, a company must be U.S.-domiciled, listed on an eligible U.S. exchange (NYSE, Nasdaq, or CBOE), have a market capitalization of at least $20.5 billion, have positive as-reported earnings over the most recent quarter and the four most recent quarters combined, and have an annual dollar value traded of at least one times the adjusted company float market cap. The index committee — a group of analysts at S&P Dow Jones Indices — makes the final selection decisions.
Market-cap weighting. This is the most important structural characteristic of the S&P 500. Companies are not weighted equally — each company’s influence on the index is proportional to its total market capitalization (shares outstanding multiplied by share price). Apple, the largest company in the index, has far more impact on the S&P 500’s daily movement than a small company near the bottom of the list.
This means the S&P 500 is, effectively, a bet on the continued growth and profitability of the largest American companies — with the biggest winners automatically becoming a larger piece of the index as their value grows.
Quarterly rebalancing. The composition of the S&P 500 is reviewed quarterly. Companies that no longer meet the eligibility criteria are removed; companies that do are added. This means the index is self-updating — it automatically rotates away from declining businesses and toward growing ones, without any investor needing to make an active decision.
What’s in the S&P 500 right now?
As of mid-2026, the S&P 500’s largest holdings are dominated by the group of technology companies sometimes called the “Magnificent Seven” — a label that reflects both their extraordinary recent growth and the concentration risk they represent.
The top seven companies by market cap weight in the index are Apple, Nvidia, Microsoft, Amazon, Alphabet (Google), Meta Platforms, and Tesla. Together, these seven companies account for approximately 30% of the entire S&P 500’s weight — meaning that roughly one in three dollars invested in an S&P 500 index fund is effectively invested in just seven companies.
The remaining 493 companies represent a broad cross-section of the American economy: banks, healthcare companies, energy producers, consumer goods manufacturers, industrial companies, utilities, real estate investment trusts, and much more. The full index covers approximately 80% of the total market capitalization of all U.S. publicly traded companies.
This concentration in a small number of large technology companies is historically unusual. For most of the S&P 500’s history, no single sector or handful of companies dominated to this degree. It is one of the structural risks investors should understand before investing — a sustained underperformance by the largest companies would disproportionately affect the index.
What has the S&P 500 actually returned?
This is where the data becomes genuinely remarkable. According to official performance data published by S&P Dow Jones Indices and independently tracked by financial researchers:
Over 100 years: The S&P 500 has delivered an annualized return of approximately 10.59% per year, including reinvested dividends, over the last 100 years. Adjusted for inflation — measuring real purchasing power rather than nominal dollars — the long-run average is approximately 7% to 7.5% per year.
Over recent decades (as of June 30, 2026):
- 1-year return: +20.86%
- 3-year annualized: +19.00%
- 5-year annualized: +11.78%
- 10-year annualized: +13.58%
- 20-year average: +11.18% annually
In 2026 specifically: As of June 30, 2026, the S&P 500 price return was +9.55% year-to-date, placing 2026 on pace to land within its historically most common range of 10% to 20% annual returns. If it holds, 2026 would be the fourth consecutive year of positive returns for the index — which has happened only rarely in the index’s long history.
One important clarification about how these numbers are presented: the “average annual return” you will see quoted in different places is almost always an annualized or compound annual growth rate (CAGR), not a simple average of year-by-year returns. The distinction matters because the math is different. A portfolio that drops 50% one year and gains 50% the next hasn’t broken even — it has lost 25% of its value. The CAGR accounts for this compounding effect and gives a more accurate picture of what investors actually experienced over time.
What does a 10% annual return actually produce over time?
Abstract percentages are hard to internalize. Concrete examples make the mathematics real.
If you invested $10,000 in an S&P 500 index fund in 1990 and reinvested all dividends, that investment would have grown to approximately $220,000 by 2026 — without adding another dollar. That is the compounding effect of roughly 10% annual returns sustained over 36 years.
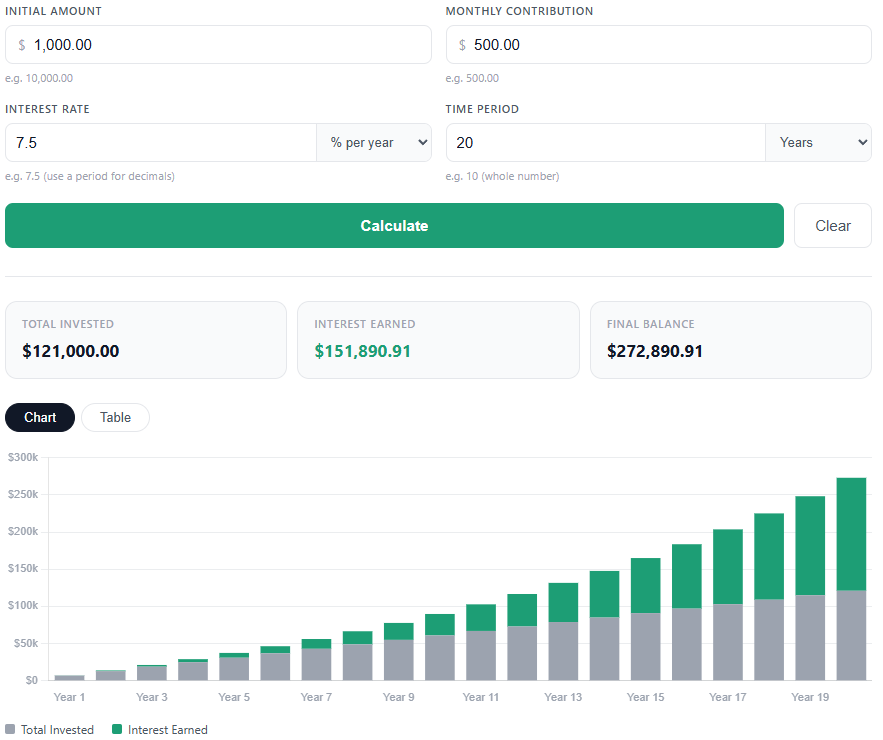
If you contributed $500 every month — a disciplined, consistent investment regardless of what markets were doing — over a 30-year period at 10% annual returns, the result would be approximately $1.13 million. Your total contributions over those 30 years would have been $180,000. The remaining $950,000 would be the work of compounding.
That gap — between what you put in and what the compounding produces — is what makes the S&P 500’s long-run return so powerful, and why starting early matters far more than starting with a large amount.
Use our free Compound Interest Calculator to run these numbers with your own figures — your monthly contribution, your current savings, and the time horizon you’re working with. It takes less than a minute and the results are often surprising.
Why do most professional fund managers fail to beat it?
Here is one of the most researched and replicated findings in all of finance: over any given 15-year period, approximately 90% of actively managed U.S. equity funds underperform the S&P 500 after fees.
This is not an accident or a coincidence. It is a structural feature of how markets work.
When a professional fund manager buys a stock, the price they pay already reflects the best available information and opinion about that company’s value — because the market price is set by millions of buyers and sellers, including many professionals analyzing the same data. To consistently outperform the index, a manager would need to consistently identify mispriced stocks that thousands of other smart, well-resourced analysts have missed. Over long periods, this is extraordinarily difficult.
The fees make it harder still. An actively managed fund that charges 1% per year in expenses needs to outperform the index by at least 1% every year just to break even for its investors. An S&P 500 index fund from a provider like Vanguard charges as little as 0.03% per year. The difference seems small; compounded over 30 years, it represents an enormous amount of money.
Peter Lynch beat the S&P 500 for 13 consecutive years — one of the most remarkable records in investment management history. But even Lynch has said publicly that most people would be better off buying an index fund than trying to replicate his approach. John Bogle founded Vanguard and created the first retail index fund specifically because he understood this math. Warren Buffett has made the same recommendation publicly and backed it up in his own estate planning.
How to invest in the S&P 500
You cannot buy the S&P 500 index directly — it is a measurement, not a tradeable security. What you can buy are funds that track it, specifically index funds and exchange-traded funds (ETFs) that hold all 500 companies in the proportions the index specifies.
The three most widely used S&P 500 funds among individual investors:
Vanguard S&P 500 ETF (VOO): expense ratio of 0.03% annually — three cents per year for every $100 invested. Managed by Vanguard, the firm John Bogle founded specifically to serve the interests of index investors. Total assets exceed $1 trillion, making it one of the largest single investment vehicles in the world. Warren Buffett has specifically named Vanguard’s fund as his recommendation for his wife’s inheritance.
SPDR S&P 500 ETF Trust (SPY): the oldest S&P 500 ETF in existence, launched in 1993. Expense ratio of 0.09% — slightly higher than VOO but with significantly higher daily trading volume, making it more commonly used by institutional traders and options market participants. For long-term individual investors, the higher cost relative to VOO is a disadvantage.
iShares Core S&P 500 ETF (IVV): managed by BlackRock, with an expense ratio of 0.03% — equal to VOO. Similar in structure and cost, with a slightly different approach to dividend reinvestment mechanics. For practical purposes, essentially interchangeable with VOO for long-term investors.
For buy-and-hold investors focused on building wealth over decades, the choice between VOO and IVV is essentially irrelevant — the cost difference is negligible. SPY has a meaningful cost disadvantage for long-term holders but is preferred by active traders for its liquidity.
How to actually buy: any brokerage account — Fidelity, Charles Schwab, Vanguard, or any major online broker — allows you to buy shares of VOO, SPY, or IVV using their ticker symbols, the same way you would buy a share of Apple or any other stock. Many brokers now allow fractional share purchases, meaning you can invest any dollar amount rather than needing to buy a complete share.
What are the risks of investing in the S&P 500?
The S&P 500’s long-run record is exceptional, but it does not mean the ride is smooth.
Short-term volatility is significant. The index has lost more than 20% of its value in a single year multiple times — in 2008, it fell 37%. It dropped 32% in a matter of weeks during the early months of the COVID-19 pandemic in early 2020. Investors who sold during either of those periods locked in those losses and missed the subsequent recoveries that followed both declines.
It only covers U.S. large-cap stocks. The S&P 500 does not include small and mid-size U.S. companies, and it does not include international markets. Investors seeking broader diversification sometimes complement an S&P 500 fund with total international market funds.
Concentration risk from large tech companies. As noted, approximately 30% of the S&P 500 is currently in just seven technology-oriented companies. If that group underperforms significantly over an extended period, the index return will reflect that — even if the other 493 companies perform well.
Inflation erodes real returns. The 10% long-run nominal return becomes approximately 7% when adjusted for inflation. In periods of high inflation — like the early 2020s — the real return on equities can be considerably lower than the nominal figure suggests.
None of these risks are reasons to avoid the S&P 500. They are reasons to understand it honestly, invest with a time horizon long enough to weather volatility, and not panic when short-term declines arrive — as they will, regularly, over any multi-decade investing life.
The S&P 500 and dollar-cost averaging
One of the most effective and stress-reducing approaches to S&P 500 investing is dollar-cost averaging: investing a fixed dollar amount at regular intervals — monthly or biweekly — regardless of where the market is trading.
When prices are high, your fixed amount buys fewer shares. When prices are low, the same amount buys more. Over time, this averages out the price you pay per share and eliminates the impossible task of trying to time entry points perfectly. It also removes the psychological barrier of waiting to invest a lump sum during a moment when markets feel uncomfortable — which is precisely when the best opportunities tend to exist.
For a full explanation of how dollar-cost averaging works and why it matters, our article on What is Dollar-Cost Averaging covers the mechanics and the evidence in detail.
Frequently Asked Questions
What is the S&P 500? The S&P 500 is a stock market index tracking 500 of the largest publicly traded companies in the United States. It is maintained by S&P Dow Jones Indices and is widely considered the most important benchmark for the overall U.S. stock market. When investors or financial media refer to “the market,” they are usually referring to the S&P 500.
What is the average annual return of the S&P 500? Over 100 years, the S&P 500 has delivered approximately 10.59% annually including reinvested dividends. Over the most recent 10 years (through June 2026), the annualized return was 13.58%. Adjusted for inflation, the long-run real return is approximately 7% to 7.5% per year. Past performance does not guarantee future results.
How do I invest in the S&P 500? You cannot buy the index directly, but you can buy ETFs that track it. The three most popular are VOO (Vanguard, 0.03% expense ratio), SPY (SPDR, 0.09%), and IVV (iShares, 0.03%). Any online brokerage account allows you to buy shares of these funds using their ticker symbols.
Why does Warren Buffett recommend the S&P 500? In his 2013 letter to Berkshire shareholders, Buffett wrote that he has instructed the trustee of his wife’s inheritance to put 90% in a low-cost S&P 500 index fund. His reasoning: the long-run return of the index, after costs, will outperform what most active managers deliver after their fees — a conclusion supported by decades of research showing roughly 90% of active funds underperform their benchmark over 15-year periods.
What is the difference between VOO, SPY, and IVV? All three track the S&P 500 index and hold the same underlying stocks in the same proportions. The key differences are expense ratio (VOO and IVV charge 0.03% annually; SPY charges 0.09%) and trading volume (SPY trades far more shares daily, making it preferred by institutional traders). For long-term buy-and-hold investors, VOO and IVV are essentially interchangeable; SPY’s higher cost is a disadvantage for multi-decade holders.
What are the biggest risks of investing in the S&P 500? The main risks are: significant short-term volatility (the index has fallen 30%+ multiple times in history), concentration in a small number of large technology companies (approximately 30% of the index is currently in seven stocks), U.S.-only exposure with no international diversification, and inflation risk (real returns are lower than nominal returns). These risks are manageable with a long time horizon and disciplined behavior.
Is the S&P 500 a good investment for beginners? For most investors — including beginners — a low-cost S&P 500 index fund is one of the most sensible long-term investments available. It provides instant diversification across 500 large American companies, has a century-long track record of approximately 10% annual returns, and requires no knowledge of individual stocks or active monitoring. Warren Buffett, John Bogle, and Peter Lynch have all recommended index investing for most people.
Sources and Further Reading
- S&P Dow Jones Indices — Official S&P 500 performance data (as of June 30, 2026): https://www.spglobal.com/spdji/en/indices/equity/sp-500/
- TradeThatSwing — Historical average S&P 500 returns (100-year, 150-year, updated June 2026): https://tradethatswing.com/average-historical-stock-market-returns-for-sp-500-5-year-up-to-150-year-averages/
- Visual Capitalist — 152 Years of S&P 500 Returns (January 2026): https://www.visualcapitalist.com/152-years-of-sp-500-returns-pyramid/
- Chase Investments — Stock Market Returns for 2026 (June 2026): https://www.chase.com/personal/investments/learning-and-insights/article/stock-market-returns-may-2026
- Warren Buffett — Berkshire Hathaway Annual Letter to Shareholders 2013 (90/10 rule): https://www.berkshirehathaway.com/letters/2013ltr.pdf
- Slickcharts — S&P 500 returns by year (updated August 2026): https://www.slickcharts.com/sp500/returns
- S&P Dow Jones Indices — S&P 500 Index Methodology: https://www.spglobal.com/spdji/en/documents/methodologies/methodology-sp-us-indices.pdf
- Vanguard — VOO ETF product page: https://investor.vanguard.com/investment-products/etfs/profile/voo
- Investing Time Daily — What is Dollar-Cost Averaging?: https://investingtimedaily.com/what-is-dollar-cost-averaging-guide/
- Investing Time Daily — The Best Books About Investing: https://investingtimedaily.com/best-books-about-investing/
- Investing Time Daily — Compound Interest Calculator: https://investingtimedaily.com/calculators/compound-interest-calculator-free/
- Investing Time Daily — How to Start Investing: Simple Guide for Complete Beginners: https://investingtimedaily.com/how-to-start-investing-beginners-guide/