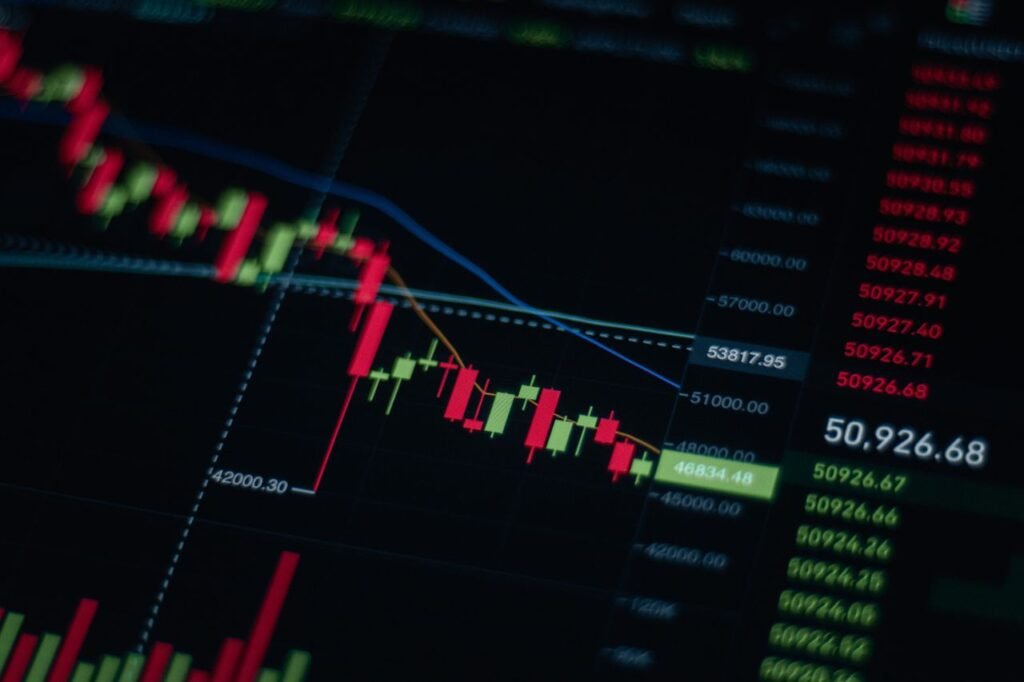
In September 2026, the 10-year Treasury yield crossed 5% for the first time since 2007.
Within 24 hours, stock markets fell. Mortgage applications dropped. Billions of dollars shifted from equities into bonds. And on financial news channels around the world, anchors repeated the same number over and over again.
A single interest rate on a U.S. government bond — and the entire financial system responded.
This is not a coincidence. The 10-year Treasury yield is, arguably, the most important number in global finance. It sits at the foundation of how banks price loans, how investors value companies, how governments measure fiscal stress, and how central banks signal their intentions.
If you have ever wondered why rising “bond yields” cause stock markets to fall, why your mortgage rate seems to move in sync with Washington’s borrowing costs, or why investors like Ray Dalio, Jamie Dimon, and Stanley Druckenmiller talk about this number constantly in 2026 — this article explains everything from the ground up.
What Is the 10-Year U.S. Treasury?
The United States government borrows money the same way a company or a person does: by issuing debt. When Washington needs to fund its budget deficit, the U.S. Treasury issues bonds — financial instruments that promise to pay back the borrowed amount, plus interest, over a fixed period.
Treasury bonds come in several maturities:
- Treasury Bills (T-bills): Short-term debt, maturing in 4 to 52 weeks
- Treasury Notes: Medium-term debt, maturing in 2, 3, 5, 7, or 10 years
- Treasury Bonds: Long-term debt, maturing in 20 or 30 years
The 10-Year Treasury Note is the benchmark. It matures exactly a decade after issuance and pays a fixed coupon rate (interest) every six months until it does.
When investors talk about “the 10-year yield,” they are referring to the annualized return an investor would earn by buying that note today at its current market price and holding it until it matures.
What Is “Yield”? The Inverse Relationship You Need to Understand
This is where most people’s intuition breaks down — and it is essential to get right.
The yield of a bond is not the same as its coupon rate. The coupon rate is fixed when the bond is issued; the yield changes every day based on what the bond trades for in the market.
Here is a simplified example:
Imagine the U.S. Treasury issues a 10-year note with a face value of $1,000 and a 4% coupon rate. That means the government promises to pay $40 per year until maturity, then return the full $1,000.
If inflation rises and investors demand higher returns to lend money, they will not buy that old bond for $1,000 anymore. They want the new bonds being issued at 5%. So the price of the existing 4% bond falls — say, to $900. Now, that same $40 annual payment represents a yield of 4.4% on the new $900 price. The coupon never changed. The price fell, so the yield rose.
This is the fundamental mechanic: bond prices and yields move in opposite directions. Always.
When the 10-year yield rises, it means:
- Investors are selling existing bonds (pushing prices down)
- New bonds are being issued at higher interest rates
- The government must pay more to borrow
When the yield falls, the reverse is true.
Why the 10-Year? Why Not the 2-Year or the 30-Year?
The U.S. yield curve spans 4 weeks to 30 years. So why does the 10-year get most of the attention?
It sits at the right point on the curve. The 2-year yield is heavily influenced by Federal Reserve policy expectations — it moves when traders expect the Fed to raise or cut rates. The 30-year yield reflects very long-term views on inflation and fiscal sustainability. The 10-year sits in the middle: long enough to capture real economic expectations, short enough to react to current conditions.
It is the benchmark for real-world borrowing. Most 30-year mortgages are prepaid or refinanced within 7 to 10 years, so lenders price them off the 10-year yield. Most corporate bonds also use the 10-year as a reference point.
It is the most liquid bond market in the world. The 10-year Treasury is traded by every major bank, central bank, hedge fund, and government on earth. Its liquidity makes it the cleanest possible benchmark — a number that genuinely reflects global capital flow.
Think of it this way: the Federal Reserve sets the overnight lending rate (the federal funds rate), which affects the very short end of the curve. But the 10-year yield is set by the market — by millions of investors around the world deciding what long-term U.S. debt is worth. That is precisely why it carries more information about where the economy is actually going.
How the 10-Year Yield Drives Everything
1. Mortgage Rates and the Housing Market
If you are buying a house or refinancing, the 10-year Treasury yield is the number you should be watching — not the Federal Reserve announcement.
The mechanics are straightforward: when banks issue 30-year mortgages, they bundle those loans and sell them to investors as mortgage-backed securities. Those investors compare the returns available on mortgage bonds against the returns available on risk-free Treasury bonds. If Treasuries offer 5%, mortgage investors demand something higher — typically 1.5 to 2.0 percentage points above the 10-year yield — to compensate for the additional risk.
As of September 2026, with the 10-year at approximately 4.9% and the spread elevated due to market volatility, 30-year fixed mortgage rates reached 6.71% (Freddie Mac weekly average). When the 10-year pushed past 5.2% in early October, mortgage rates climbed toward 7.28%.
The practical effect: a $400,000 mortgage at 7.28% costs approximately $2,730 per month in principal and interest. At the 2.65% low of January 2021, that same mortgage cost $1,613 per month. The 10-year yield, in its ascent from near zero to above 5%, effectively added more than $1,100 to the monthly payment on a $400,000 home.
This is why housing markets seize when yields spike. It is not just sentiment — it is arithmetic.
2. Corporate Borrowing Costs
Companies borrow money by issuing bonds of their own. But corporate bonds carry more risk than Treasuries (companies can default; the U.S. government, in theory, cannot), so investors demand a credit spread — an additional premium above the Treasury yield.
When the 10-year yield rises, the entire corporate bond market rises with it. A company that issued 10-year debt at 4.5% when Treasuries yielded 2% will face financing costs of 7%+ when Treasuries yield 5%. This affects:
- Stock buybacks: Companies borrow cheaply to repurchase their own shares, boosting earnings per share. At higher rates, this math no longer works.
- Mergers and acquisitions: Private equity deals depend on cheap leverage. At 7-8% borrowing costs, the deals that made sense at 4% often do not pencil out.
- Capital investment: Companies defer expansion when the cost of capital is high.
Every dollar of corporate debt in the world is repriced, in part, off the 10-year Treasury yield.
3. Stock Market Valuations
This is perhaps the most consequential and least understood mechanism.
Every professional stock analyst uses a model called Discounted Cash Flow (DCF) to estimate the value of a company. The core idea: a company’s fair value today equals all of its future profits, discounted back to present value. The rate used to do that discounting is the risk-free rate — which, in practice, is the 10-year Treasury yield.
Here is the math in plain language: if money invested today at 5% (risk-free) doubles in roughly 14 years, then a company promising profits 15 years from now has to compete with that certainty. The higher the risk-free rate, the more those distant profits get discounted — and the lower the present value of the company.
This effect falls heaviest on growth stocks — companies like early-stage tech firms whose profits are expected far in the future. A company projecting most of its earnings in years 10 through 20 sees its valuation crushed when the discount rate rises. A utility company earning steady cash flows today is far less affected.
This is why 2022 was so brutal for Nasdaq and growth stocks: the 10-year yield went from 1.5% at the start of the year to nearly 4% by December. Valuations that had been built on a near-zero discount rate had to be entirely repriced.
Beyond valuation models, there is also the competition effect: when Treasuries yield 5%+, income investors can hold risk-free government debt and earn solid returns. As the Motley Fool noted in September 2026, with the S&P 500 offering a dividend yield of roughly 1%, Treasuries at 5% represent a compelling alternative for conservative capital — drawing money out of equities.
4. The U.S. Dollar
The 10-year yield and the U.S. dollar tend to move together, though the relationship is not mechanical.
When U.S. yields rise, foreign investors want to own U.S. debt — earning more interest on the world’s safest asset. To buy U.S. Treasuries, they must first buy U.S. dollars. This demand strengthens the dollar.
A stronger dollar creates ripple effects globally:
- Commodities (priced in dollars) become more expensive for non-U.S. buyers
- Emerging market debt (often denominated in dollars) becomes harder to service
- U.S. exporters become less competitive, as American goods cost more abroad
This is why, when the 10-year yield rises sharply, financial stress tends to spread beyond the U.S. borders.
5. Emerging Markets
Countries that borrowed in U.S. dollars face a double squeeze when U.S. Treasury yields spike: their debt service costs rise, and the dollar they need to pay those costs becomes more expensive relative to their own currencies.
This is why the 10-year Treasury yield matters in São Paulo, Lagos, Jakarta, and Istanbul — not just in New York.
What Moves the 10-Year Yield?
The 10-year yield is not set by any single authority. It emerges from the collective decisions of every investor in the world. That said, four main forces dominate:
Inflation Expectations
The most powerful driver. If investors expect inflation to run at 4% per year for the next decade, they will not accept a 3% yield on a Treasury note — they would be losing real purchasing power. They demand a yield that compensates for expected inflation plus a real return. When inflation expectations rise, yields rise. When they fall, yields follow.
Federal Reserve Policy
The Fed controls the overnight federal funds rate, not the 10-year yield directly. But its signals about the future path of rates deeply influence how the market prices long-term debt. When the Fed signals it will keep rates high for longer (“higher for longer”), long-term yields tend to rise in anticipation.
Economic Growth Expectations
A fast-growing economy generates more demand for credit (businesses borrow to expand, consumers spend) and more inflation risk. Both push yields higher. A slowing economy reduces credit demand and inflation expectations, pulling yields lower.
Fiscal Policy and Debt Supply
This is the factor that dominated 2026. The U.S. Treasury must issue new bonds constantly to finance the deficit. When deficits are large, the supply of new bonds is large — and like any market, more supply means lower prices and higher yields.
According to CBO projections, the FY2026 federal deficit is running at approximately $1.9 trillion — roughly 5.8% of GDP. The U.S. has borrowed more in the first ten months of fiscal year 2026 than it did in all of fiscal year 2025. With the national debt approaching $40 trillion, annual net interest payments are projected to reach $1.0 trillion in 2026, surpassing defense spending.
When the market doubts fiscal discipline, it demands a higher “term premium” — extra compensation for holding long-term U.S. debt. This structural pressure is one reason yields have not retreated even as the Fed has signaled eventual rate cuts.
50 Years of Context: The Rise, the Fall, and the Return
To understand where we are today, you need to see the arc of the past five decades.
1981: The all-time peak. The Federal Reserve, under chairman Paul Volcker, raised interest rates to 20% to break double-digit inflation. The 10-year Treasury yield reached as high as 15.82%. Mortgages cost 18%. It was the most aggressive monetary tightening in American history — and it worked. Inflation was crushed.
1981–2020: The great 40-year decline. From that 1981 peak, Treasury yields fell for four decades in one of the greatest secular trends in financial history. Each economic cycle saw yields reach a lower high than the last. By the time COVID-19 hit in 2020, the 10-year yield fell to an all-time modern low of 0.89% — a number that would have seemed impossible even in 2018.
This 40-year bond bull market made fortunes. Howard Marks of Oaktree Capital described it memorably in his December 2022 “Sea Change” memo: for four decades, every investor had been operating with a tailwind — falling rates that mechanically boosted the value of every financial asset. Bonds, stocks, real estate, private equity — all were inflated by the gravitational pull of declining rates.
2022–2026: The reversal. Beginning in early 2022, inflation surged to 9.1% — the highest since 1981. The Federal Reserve raised rates 11 times in 15 months, taking the federal funds rate from near zero to over 5%. The 10-year yield rose from 1.5% to nearly 5% by October 2023.
A brief reprieve followed: the Fed cut rates in late 2024, and yields pulled back. But in 2026, yields resumed their climb, driven by persistent inflation, fiscal concerns, and an escalating geopolitical situation.
Key historical data points for reference:
| Year | 10-Year Yield |
|---|---|
| 1981 (annual avg) | 13.91% |
| 2008 (financial crisis) | 3.67% |
| 2012 (post-crisis low) | 1.80% |
| 2020 (COVID low) | 0.89% |
| 2022 | 2.95% |
| 2023 | 3.96% |
| 2024 | 4.21% |
| 2025 | 4.26% |
| October 2026 | ~5.28% |
What the Smartest Investors Are Saying in 2026
Three of the most closely watched voices in global finance have been unusually vocal about the 10-year yield in 2026. Their views are not identical — but they rhyme.
Ray Dalio
The founder of Bridgewater Associates, the world’s largest hedge fund, has been warning for years that the U.S. fiscal situation is approaching an inflection point. In 2026, he stated:
“I am confident that the government’s financial condition is at an inflection point.”
Dalio estimates that federal spending runs roughly 40% above revenue, with debt-service needs approaching levels that crowd out spending on everything else — defense, entitlements, and investment. His estimate for a U.S. debt reckoning: “within three years, give or take two.”
Read Ray Dalio’s portfolio: https://investingtimedaily.com/ray-dalio-portfolio/
Stanley Druckenmiller
The legendary macro investor, who ran George Soros’s Quantum Fund through some of its most famous trades, published an op-ed in the Financial Times in September 2026 taking direct issue with the Treasury Department’s strategy of buying back bonds to suppress yields.
His argument: with federal debt exceeding $40 trillion and deficits running near 6% of GDP during full employment — when the economy should be generating surpluses, not record deficits — artificially suppressing yields treats the symptom, not the disease.
His prediction: the 10-year yield will reach 5.50%. His framing was characteristically blunt:
“If the 30-year must trade at 5.5% to clear, that isn’t a crisis. It is an invoice.”
Read Stan Druckenmiller’s portfolio: https://investingtimedaily.com/stanley-druckenmiller-portfolio/
Jamie Dimon
JPMorgan Chase’s CEO told Bloomberg Television in May 2026 that he would not buy stocks or long-term Treasury bonds at current prices. His reasoning:
“We may have gone from a saving glut to not enough savings.”
Dimon warned that structural forces — declining foreign demand for U.S. debt, persistent inflation, and decades of deficit spending — mean rates could “easily go up more.” He specifically flagged the risk that markets are underestimating how elevated yields could climb before the situation stabilizes.
The three men agree on the mechanism even if they disagree on the timing: the era of cheap money that defined the financial landscape from 2008 to 2022 is over. The 10-year yield is the clearest signal of that shift.
What Does It Mean for You?
Whether you realize it or not, the 10-year Treasury yield already affects your daily financial life.
If you own a home or are buying one: Mortgage rates follow the 10-year closely. Every 1 percentage point move in the yield translates to roughly $80 to $120 more per month in payments on a $300,000 mortgage.
If you invest in stocks: Higher yields compress valuations, particularly for growth stocks. The “TINA” trade — “There Is No Alternative” to stocks — disappears when Treasuries yield 5%. At that level, institutional investors have a genuine alternative, and capital flows accordingly.
If you have bonds in your portfolio: Rising yields mean falling prices on existing bonds. The longer the duration of your bond holdings, the more sensitive they are to yield moves.
If you hold cash in savings accounts or money market funds: Rising yields are good news. Rates on savings accounts, CDs, and money market funds tend to follow Treasury yields higher, giving savers their best returns in 15 years.
If you live in an emerging market country: A rising U.S. yield strengthens the dollar, making dollar-denominated debt more expensive to service and increasing financial pressure on governments and companies across the developing world.
The Bottom Line
The 10-year Treasury yield is not an abstraction. It is the baseline price of money in the world’s largest economy — the number against which every other financial asset is measured, every major loan is priced, and every investment decision is ultimately made.
For four decades, that number fell. The financial system built itself around the assumption that it would keep falling. When it reversed, the consequences were felt everywhere at once: in housing markets, in tech valuations, in government budgets, and in the retirement accounts of ordinary savers.
At 5.28% in October 2026 — levels not seen since 2002 — the 10-year yield is no longer a background number. It is the central variable in the global economy. Understanding what it is, what moves it, and what it signals is no longer optional for any serious investor.
FAQ
What is the 10-year Treasury yield right now? As of early October 2026, the 10-year U.S. Treasury yield is approximately 5.28%, representing a multi-decade high. It briefly touched 5.34%, its highest level since 2002. The yield has risen significantly from the 0.89% pandemic low recorded in 2020.
Why does the 10-year Treasury yield matter? It is the global benchmark for long-term borrowing costs. Mortgage rates, corporate bond yields, and the discount rate used to value equities are all priced off the 10-year Treasury yield. When it moves, the entire financial system moves with it — which is why investors, homebuyers, and central banks watch it constantly.
What causes the 10-year Treasury yield to rise? The main drivers are higher inflation expectations, expectations of tighter Federal Reserve policy, stronger economic growth (which increases demand for credit), and larger government deficits (which require more bond issuance, pushing prices down and yields up). In 2026, all four factors are contributing simultaneously.
How does the 10-year yield affect mortgage rates? Mortgage lenders price 30-year fixed loans at roughly 1.9 to 2.0 percentage points above the 10-year Treasury yield. When the 10-year yield rises from 2% to 5%, mortgage rates typically rise from around 4% to around 7% — which materially changes monthly payments and housing affordability for millions of buyers.
Why do stock prices fall when Treasury yields rise? Two reasons. First, higher yields compress stock valuations by increasing the discount rate used in financial models — future earnings are worth less today when the risk-free rate is higher. Second, at 5%+ yields, risk-free Treasury bonds offer genuine competition for investment capital that might otherwise flow into equities.
Is a 5% 10-year Treasury yield historically high? In absolute terms, no. The 10-year yield peaked at nearly 16% in 1981. The historical average since the 1960s is approximately 4.25%. However, 5% is high relative to the near-zero environment that persisted from 2008 to 2022, and the speed of the ascent — from 0.89% in 2020 to 5%+ in 2026 — created significant stress for financial systems built around cheap money.
What is the difference between the 10-year yield and the Federal Reserve’s interest rate? The Federal Reserve sets the federal funds rate, which is the overnight rate at which banks lend to each other — it sits at the very short end of the yield curve. The 10-year yield is set by market forces: millions of investors around the world deciding what long-term U.S. government debt is worth. The Fed influences the 10-year yield indirectly through signals about future policy, but does not control it directly.
What do Ray Dalio and Stanley Druckenmiller predict for yields? Druckenmiller predicted in September 2026 that the 10-year yield will reach 5.50%, framing current deficits as a structural “invoice” that the bond market will eventually present. Dalio warned that the U.S. government’s fiscal condition is at an inflection point and predicted a potential debt shock within a three-to-five year window. Both argue the era of artificially low rates is over.
SOURCES
- Trading Economics — US 10-Year Treasury Note Yield (current data, October 2026): https://tradingeconomics.com/united-states/government-bond-yield
- Axios — “The mystery of spiking Treasury yields” (October 2, 2026): https://axios.com/2026/10/02/the-mystery-of-spiking-treasury-yields
- Fortune — “The 10-year Treasury yield just hit 5% for the first time since 2007” (September 22, 2026): https://fortune.com/2026/09/22/10-year-treasury-yield-5-2007-stagflation-1970s/
- Motley Fool — “What’s the Significance of the 10-Year Treasury Yield?” (September 23, 2026): https://www.fool.com/investing/2026/09/23/whats-the-significance-of-the-10-year-treasury-yie/
- CryptosBriefing — “Stanley Druckenmiller says 10-year yield will hit 5.50%” (September 2026): https://cryptobriefing.com/druckenmiller-us-borrowing-costs-low-yield-prediction/
- Yahoo Finance — “Ray Dalio Says Interest Costs Are Crowding Out Everything Else”: https://finance.yahoo.com/economy/policy/articles/ray-dalio-says-interest-costs-222107955.html
- CRE Daily — “Jamie Dimon Warns Treasury Yields Could Climb Higher”: https://www.credaily.com/briefs/jamie-dimon-warns-treasury-yields-could-climb-higher/
- Nevada Real Estate Group — “How the 10-Year Treasury Moves Mortgage Rates: 2026 Guide”: https://www.nevadarealestategroup.com/blog/how-the-10-year-treasury-moves-mortgage-rates-2026/
- CRFB — “Treasury Confirms $1.8 Trillion Deficit for First 10 Months of FY 2026”: https://www.crfb.org/press-releases/treasury-confirms-18-trillion-deficit-first-10-months-fy-2026
- CBO — “The Budget and Economic Outlook: 2026 to 2036”: https://www.cbo.gov/publication/62105
- InvestEdge360 — “US 10-Year Treasury Yield: 50-Year History & Chart”: https://investedge360.com/blog/us-10-year-treasury-yield-50-year-history-chart
- Norada Real Estate — “What Are the Historical Trends of the 10-Year Treasury Yield?”: https://www.noradarealestate.com/blog/what-are-the-historical-trends-of-the-10-year-treasury-yield/